Opal offers a metrics Dashboard to organization admins with graphs and data on request and access patterns, as well as the ability to filter the data.
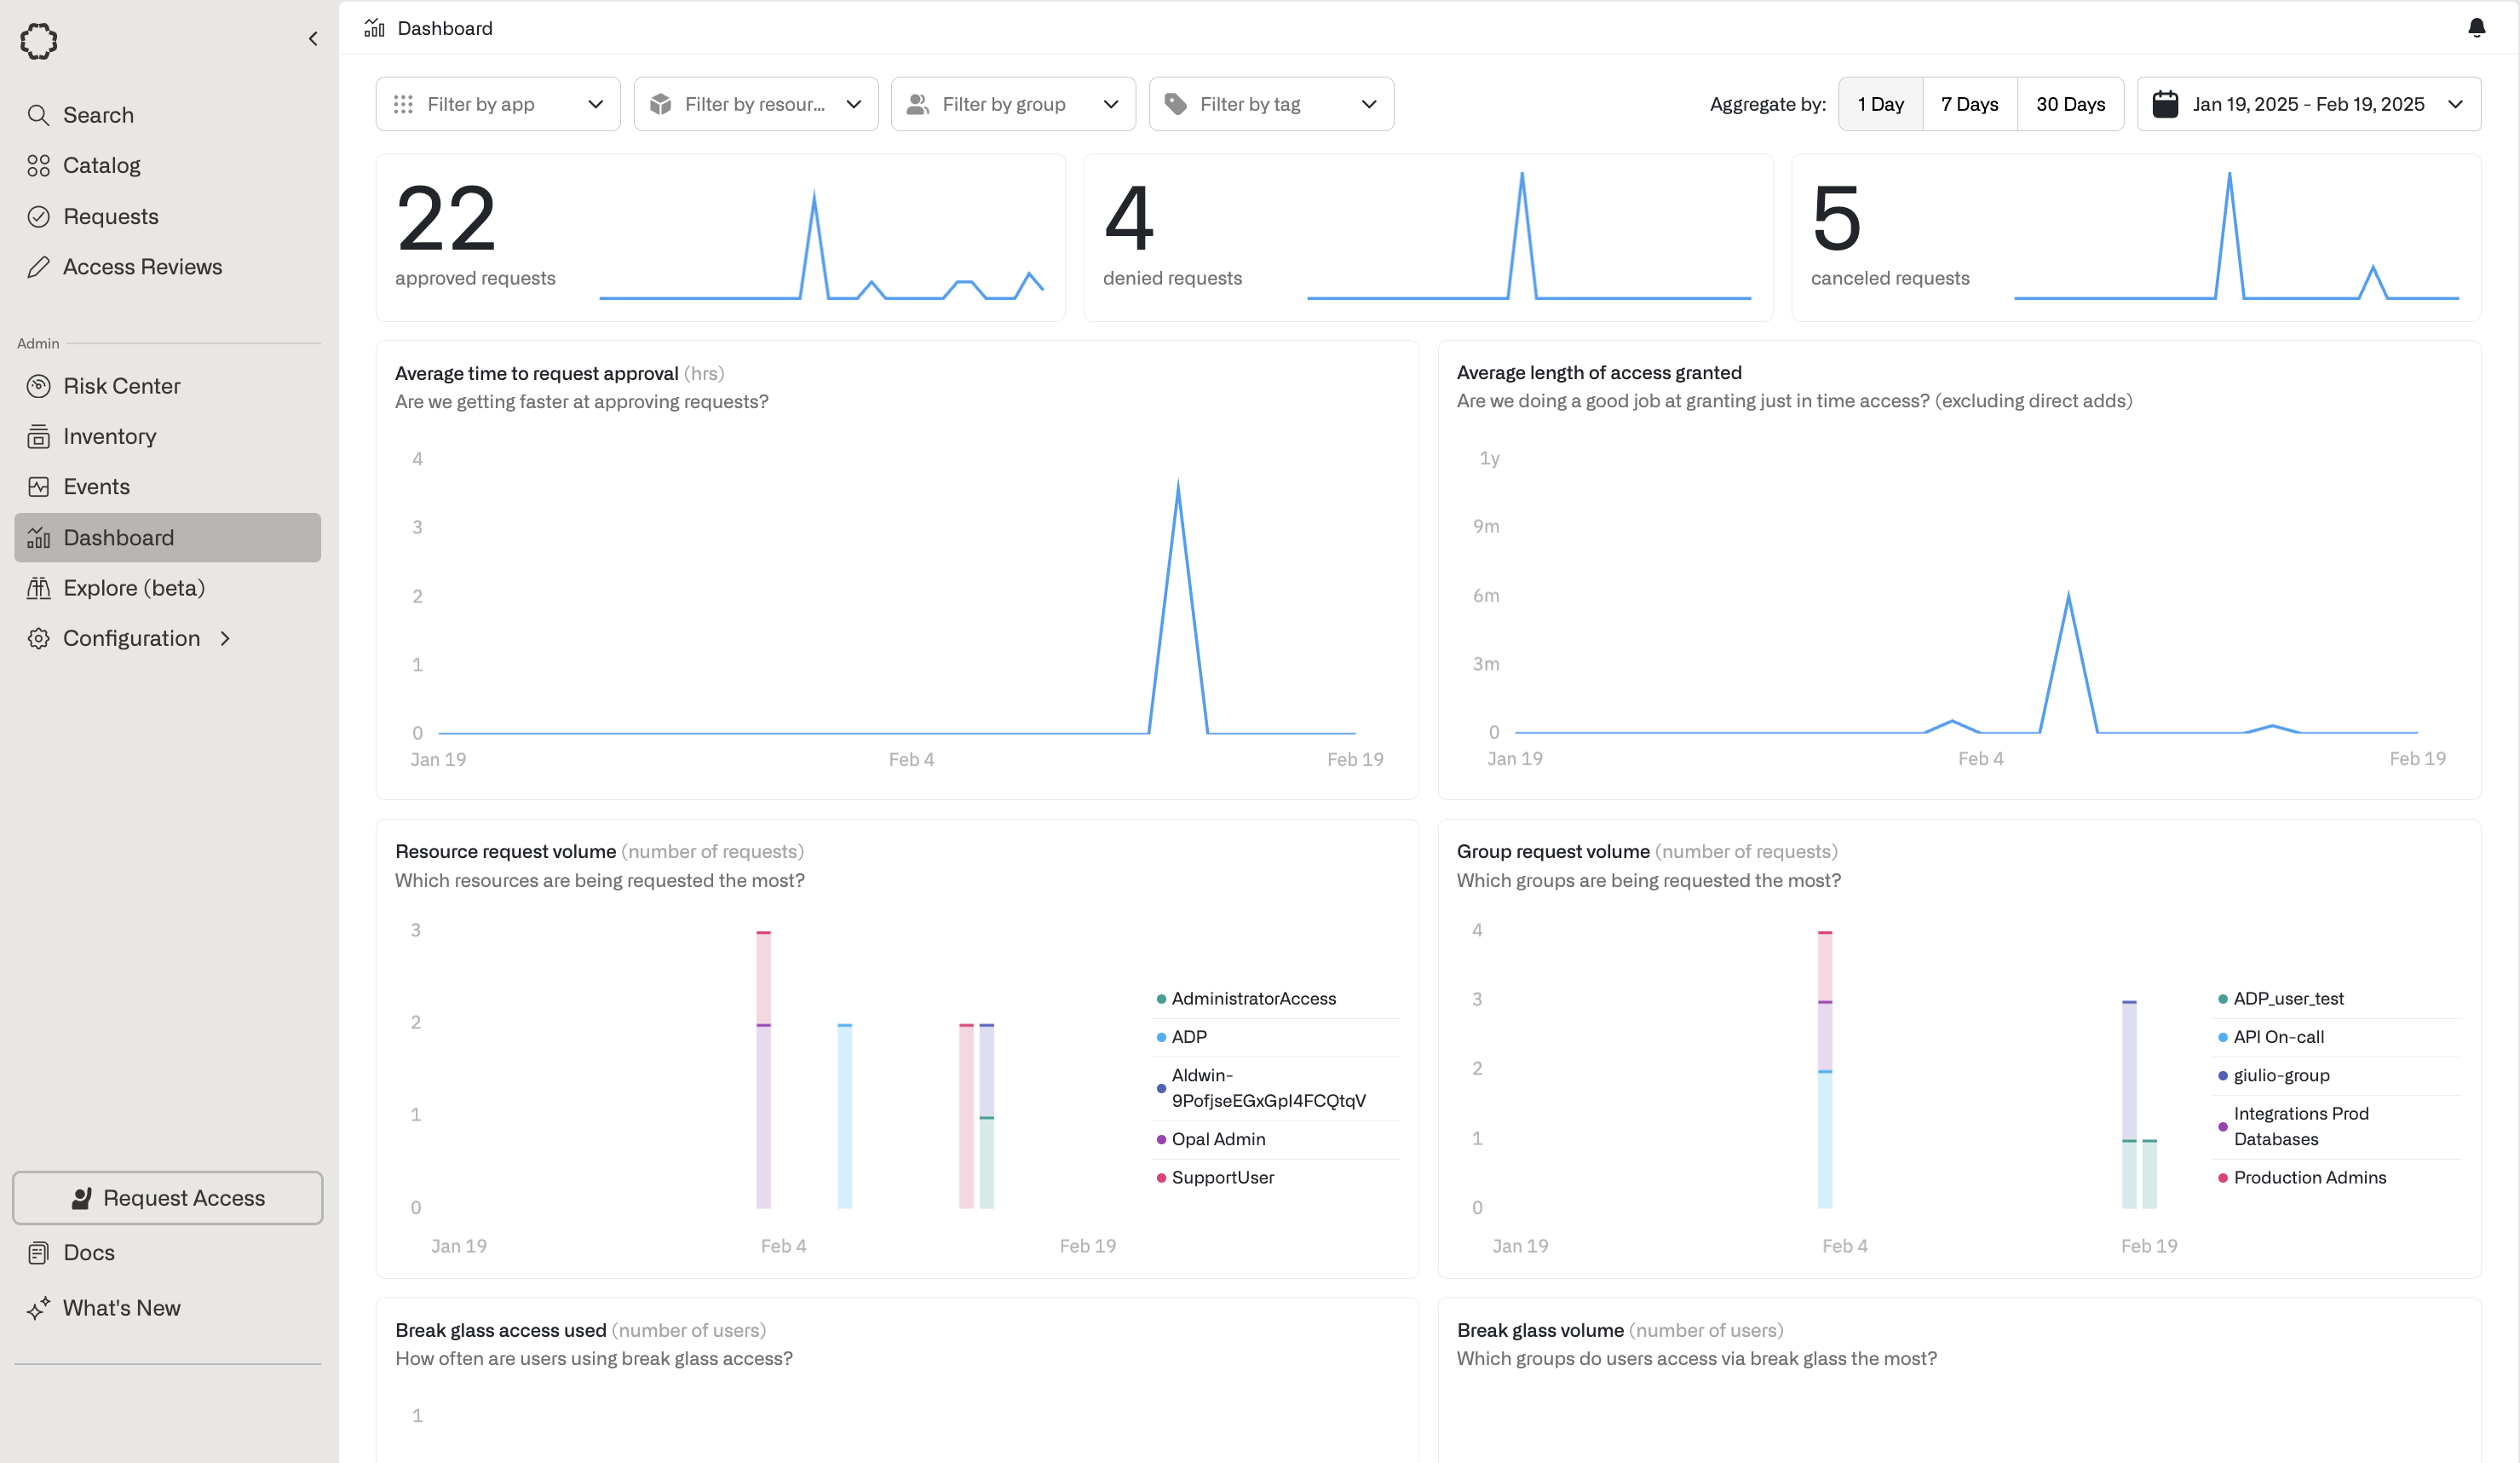
Metric types
- Request status spark lines - See trends of number of requests approved, denied, and canceled over time.
- Average time to request approval - See how quickly your organization’s requests are getting approved. Includes manual, admin, and auto approvals.
- Average length of access granted - See how much access time requests are granting. This does not include admins directly adding users to resources and groups.
- Resource/Group request volume - See which resources and groups are being requested the most.
- Break glass usage - See how often break glass access is being used, and for which groups.
- Closed requests - See what methods are being used to close requests. Includes auto approval, manual approval, admin override approval, denied, and canceled.
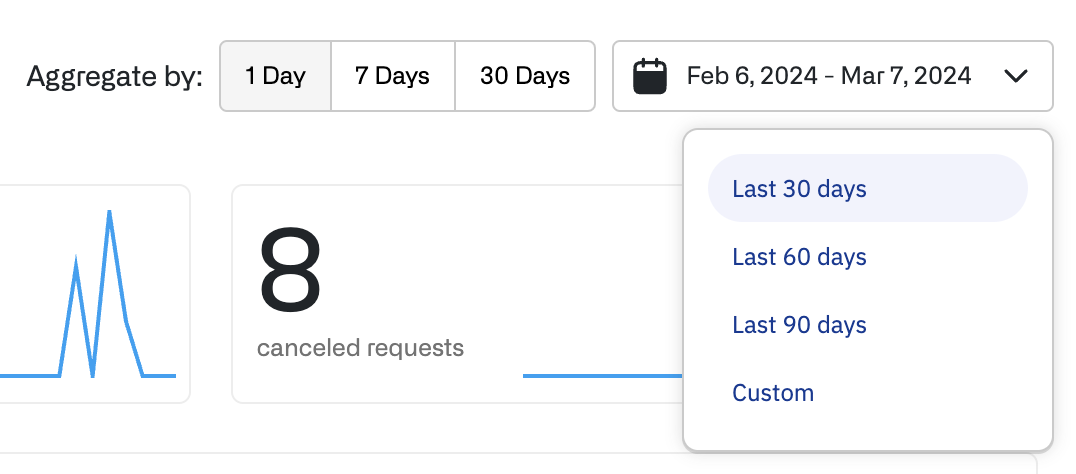
Time range and aggregates
Change the time range of the data with the date picker in the top right. Select one of the preset ranges, or choose Custom to select a custom start and end dates.
Choose from three duration options—1 day, 7 days, 30 days—to aggregate the data by.
Filters
Apply filters to scope down the data to specific apps, entities, or tags. Last modified on September 11, 2025